Scorecard
| Current Price | Overvalued | |
| Yield (%) – Higher is better Current Yield: 2.84% Industry Average: 4.20% | ||
| Dividend Growth (%) – Higher is better Dividend Growth: 4.76% Industry Average: 5.05% | ||
| Returns (%) – Higher is better Returns: 28.89% Industry Average: 17.20% | ||
| Free Cash Flow Payout Ratio (%) – Lower is better Coming Soon FCFPR: 0.00% Industry Average: 0.00% | ||
AMERICAN ELECTRIC POWER COMPANY, INC.
(XNAS:AEP)
Industry: Electrical Utilities & IPPs
| Price | Change (Daily) |
| $ 133.74 | $ 3.44 |
Dividend
Annual Dividend | Annual Yield |
$ 3.80 | 2.84 % |
Dividend Streak | 5 Year Average |
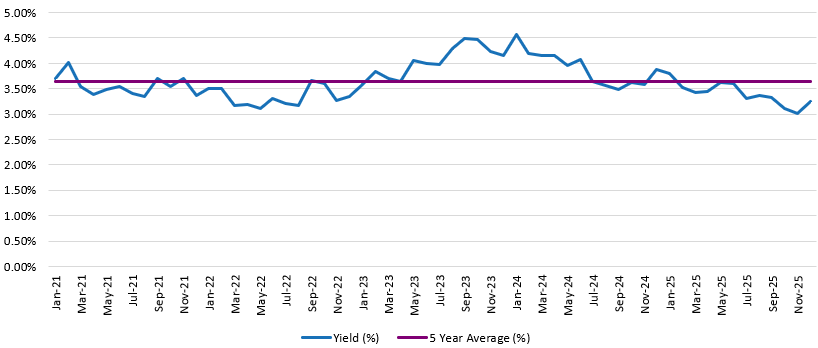
16 year(s) | 3.65 % |
Yield History
Fair Price
Current Stock price is considered: Overvalued
| Current Price ● $133.74 |
| Less Than $96.56 | $96.56 – $110.53 | More Than $110.53 |
| Undervalued | Fair Price | Overvalued |
Using average Dividend Yield for stock valuation. Learn about this method for Fair Price analysis HERE.
Growth
Dividend Growth Rate
1 Year | 3 Year | 5 Year |
4.76 % | 5.67 % | 5.66 % |
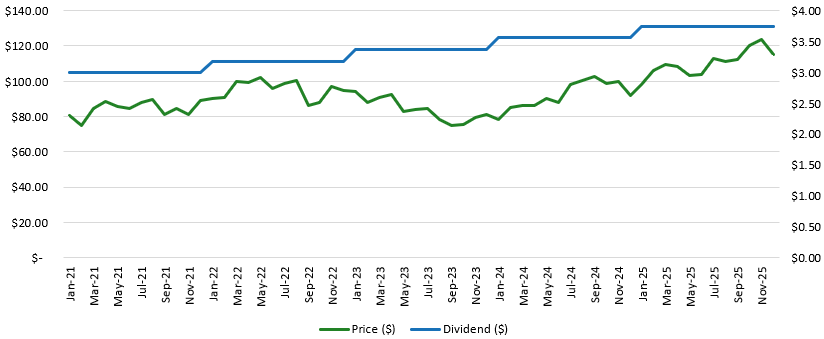
Dividend History
| 2021 | 2022 | 2023 | 2024 | 2025 |
| $3.00 | $3.17 | $3.37 | $3.57 | $3.74 |
Price Return
1 Year | 5 Year | CAGR 5 Years |
$ 29.98 28.89 % | $ 49.15 | 9.59 % |