Scorecard
| Current Price | Undervalued | |
| Yield (%) – Higher is better Current Yield: 4.50% Industry Average: 2.30% | ||
| Dividend Growth (%) – Higher is better Dividend Growth: 13.46% Industry Average: 8.45% | ||
| Returns (%) – Higher is better Returns: -45.81% Industry Average: -22.04% | ||
| Free Cash Flow Payout Ratio (%) – Lower is better Coming Soon FCFPR: 0.00% Industry Average: 0.00% | ||
ACCENTURE PUBLIC LIMITED COMPANY
(XNYS:ACN)
Industry: Software & IT Services
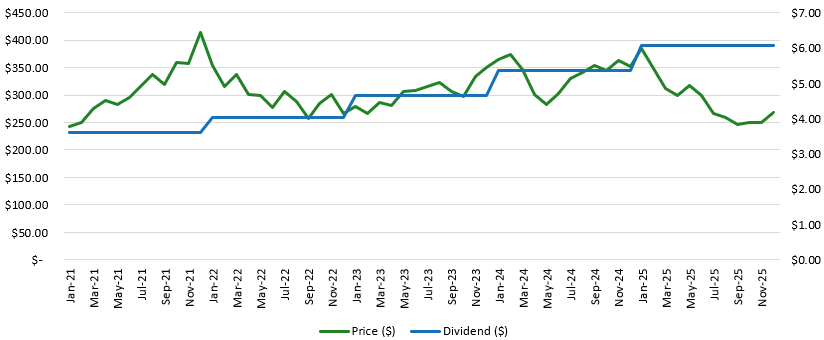
| Price | Change (Daily) |
| $ 144.73 | $ 1.16 |
Dividend
Annual Dividend | Annual Yield |
$ 6.52 | 4.50 % |
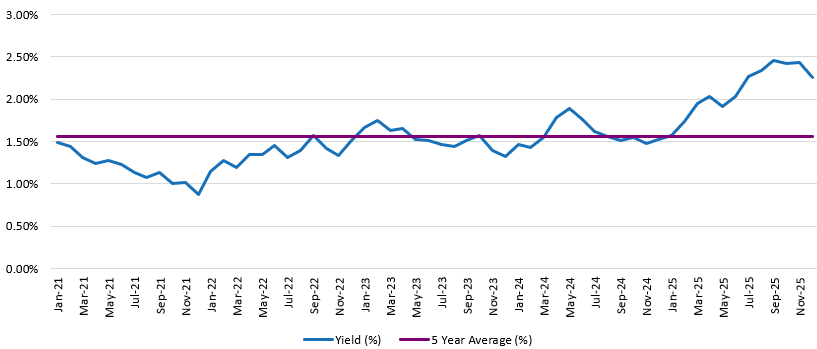
Dividend Streak | 5 Year Average |
14 year(s) | 1.56 % |
Yield History
Fair Price
Current Stock price is considered: Undervalued
| Current Price ● $144.73 |
| Less Than $322.96 | $322.96 – $507.68 | More Than $507.68 |
| Undervalued | Fair Price | Overvalued |
Using average Dividend Yield for stock valuation. Learn about this method for Fair Price analysis HERE.
Growth
Dividend Growth Rate
1 Year | 3 Year | 5 Year |
13.46 % | 14.63 % | 13.12 % |
Dividend History
| 2021 | 2022 | 2023 | 2024 | 2025 |
| $3.61 | $4.03 | $4.65 | $5.35 | $6.07 |
Price Return
1 Year | 5 Year | CAGR 5 Years |
$ -122.37 -45.81 % | $ -172.95 | -14.55 % |