Scorecard
| Current Price | Overvalued | |
| Yield (%) – Higher is better Current Yield: 0.36% Industry Average: 1.54% | ||
| Dividend Growth (%) – Higher is better Dividend Growth: 4.04% Industry Average: 10.30% | ||
| Returns (%) – Higher is better Returns: 41.90% Industry Average: 34.68% | ||
| Free Cash Flow Payout Ratio (%) – Less is better Coming Soon FCFPR:0.00 Industry Average: 0.00% | ||
APPLE INC.
(XNAS:AAPL)
Industry: Computers, Phones & Household Electronics
| Price | Change (Daily) |
| $ 291.13 | $ -4.50 |
Dividend
Annual Dividend | Annual Yield |
$ 1.04 | 0.36 % |
Dividend Streak | 5 Year Average |
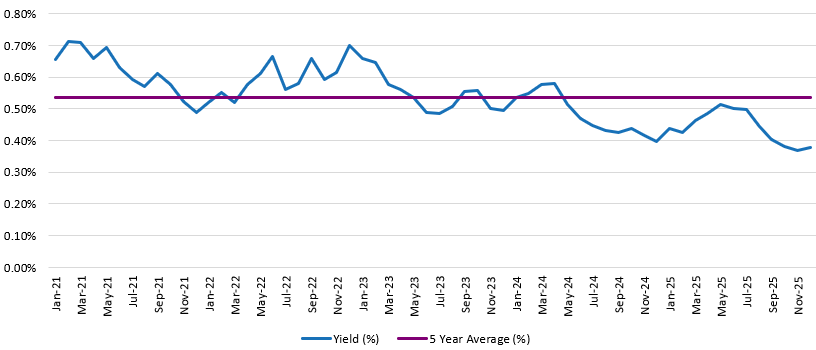
13 year(s) | 0.54 % |
Yield History
Fair Price
Current Stock price is considered: Overvalued
| Current Price ● $291.13 |
| Less Than $200.56 | $200.56 – $192.02 | More Than $192.02 |
| Undervalued | Fair Price | Overvalued |
Using average Dividend Yield for stock valuation. Learn about this method for Fair Price analysis HERE.
Growth
Dividend Growth Rate
1 Year | 3 Year | 5 Year |
4.04 % | 4.22 % | 4.99 % |
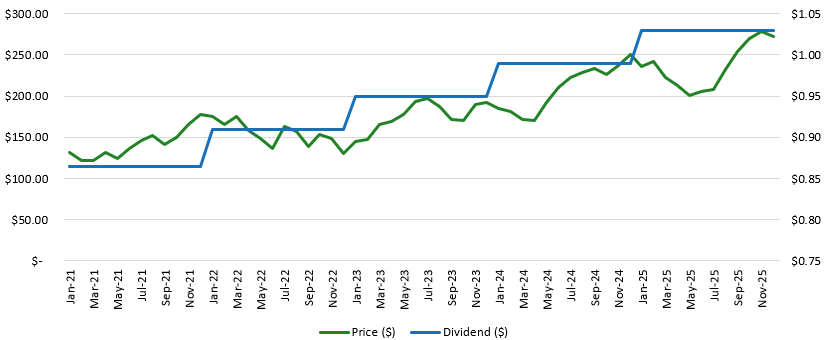
Dividend History
| 2021 | 2022 | 2023 | 2024 | 2025 |
| $0.87 | $0.91 | $0.95 | $0.99 | $1.03 |
Price Return
1 Year | 5 Year | CAGR 5 Years |
$ 85.96 41.90 % | $ 154.17 | 16.28 % |