How to Use the List
Start by getting familiar with the Master List table format.
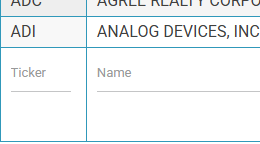
The default order is alphabetical A-Z of the Ticker Column.
You can click any of the columns to organize it A-Z or Z-A.
| Symbol | Description |
| Pick the number of entries displayed at a time | |
| Select any Columns you do not want displayed. | |
| Search bar if you are looking for a particular piece of information. It will scan the whole List. | |
 | At the bottom of each column you will find a way to search that whole column. You can search the Ticker, Name, Industry and Value by just typing it. This will search exactly what you type or if it contains some letters of the word. |
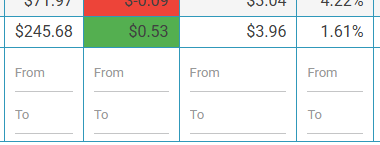 | At the bottom of most columns you will also find From / To. These allow to put a range of data for each Column, this is key to find exactly what you’re looking for to get a nice range of results. |
| This will reset all data you inputted to the table. |
Click Here to see an Example using the List
Example 1
Lets say you want to pick a new Stock based a good average Dividend performance and you don’t want to spend too much per share.
| On the Price Column go the bottom and put your information. We’ll say we want a stock not more than $50 current share price. Type 50 on To space. | 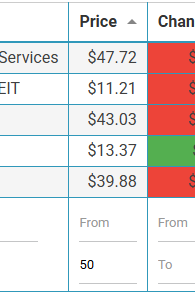 The List will update to show stocks that cost less than $50. |
| On the Yield Column put the range of the minimum amount of Yield you want to go. We’ll leave Top blank and add 3 to From. | 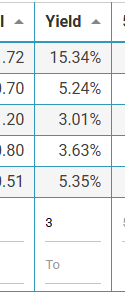 The list will update to show all stocks that have more than 3% Yield. |
| We want to have a good consistent increase in Dividends. On Div. Growth 1 Y, 3 Y and 5 Y Leave the Top blank and add 5 to From. | 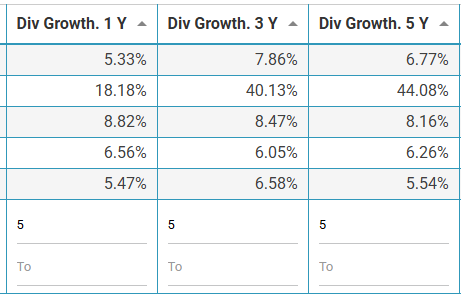 The List will update to show all stocks with Dividend Growth of more than 5% |
| While we are looking for mostly dividends we do want a stock that has some good price appreciation the last few years. On Returns 5 Y column add leave Top blank and add 20 to From. | 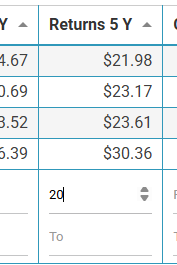 The List will update to show all stocks with $20 or more returns in the past 5 years. |
| Based on all these filters only four companies meet the criteria and would be a great investment idea. As of July 18, 2025 when this example was made. | 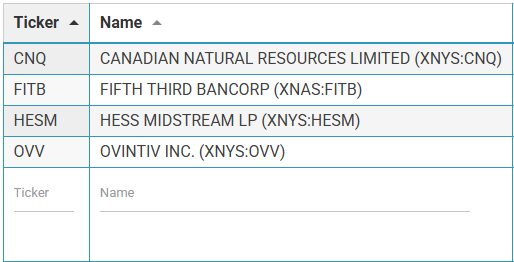 |
| However, one of the most crucial sources of information of the site lies on the Value column, you’ll see one of these Stocks is considered Overvalued and might not be at a good purchase price right now, leaving three Fair Valued choices. | 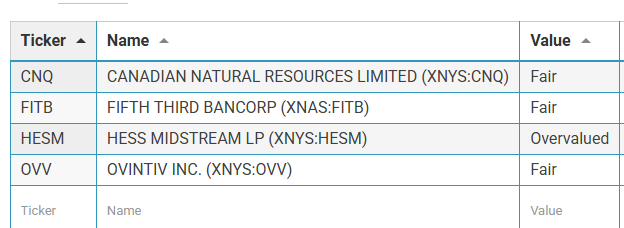 This uses the average Dividend Yield for stock valuation. More about this method for Fair Price analysis HERE |
Click Here for another Example using the List
Example 2
Lets say you want to pick a new Stock based on an Industry that interests you or you want to diversify into.
| On the Industry Column type the one you’re interested in. We’ll use Aerospace & Defense. | 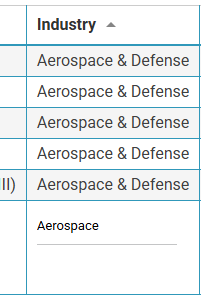 The List will show all Stocks under that Industry. |
| Since we are focused on one industry let’s see averages. Another great source of information from the site is the Average columns. The Growth 1 Year Industry column tells us on average we have 15.15% growth for all Aerospace & Defense stocks on the site. | 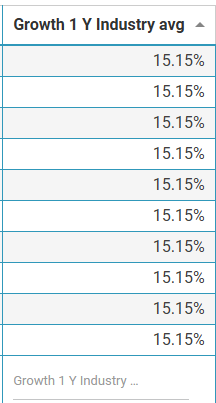 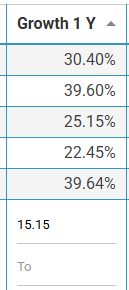 We will add 15.15 on the Growth 1 Y column. |
| Now we will look at the Yield Industry Average. Average Yield is 1.30%. | 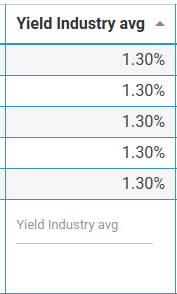 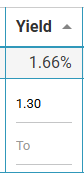 Adding 1.3 to the Yield will update the table to one result. |
| This will give you one result. RTX has above its Industries averages making it a good choice among its peers. The Value Column gives it a Fair price as of July 18th, 2025. | 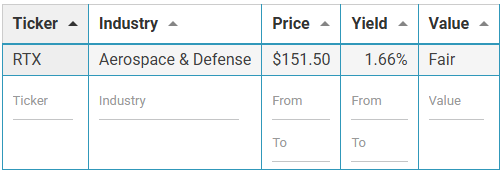 RTX would be a great company to invest compared to others based on industry averages. |
Header Description and Explanation
This describes what each header title means on the Master List and on the page of each Ticker Symbol.
In some cases a small description on why it is an important reference.
| Ticker |
| Ticker Symbol. |
| Name |
| Name of the Company |
| Industry |
| The Industry the company belongs to, this is not the same as Sector. |
| Price |
| Last price of the stock as of 4 pm of the last trading day. |
| Change |
| Last price of the stock as of 4 pm of the last trading day in dollars. This is a good reference to see if the stock closed lower or higher in price. |
| Div Annual |
| Total dividend annually in dollars. This gives you an idea of how much money in dividends per share you will be getting a year. When comparing stock prices and dividends this is a great way to know if you will be getting more money in dividends by investing less per share as you will know how much you will get in dollars by the amount invested. |
| Yield |
| Total Dividend Yield in percentage. This gives you a good indication of how much of the total price of the stock is being given as a dividend. Higher means more money, but might not always be a good thing. |
| 5 Year avg |
| Past five years dividend average in percentage. Good reference to see how the price is behaving based on the yield of the stock moving up or down. |
| Value |
| Current value of the stock based on the 5 year average yield and current price. The stock can be Undervalued, Fair or Overvalued. For more information on Dividend Yield for stock valuation Fair Price analysis check out this article. |
| Div. Streak |
| Number of years the company has consistently raised the dividend. Good reference to see the company has constant growth and is serious about dividend payments. Note that this will reset also if the company keeps the dividend the same two years in a row. |
| Div Growth. 1 Y |
| Dividend Growth in the last year in percentage. The higher the better, this tells you how much of an increase the dividend grew or did not. Think of it the same way as a raise at your job, the higher the percentage the more you will get. |
| Div Growth. 3 Y |
| Dividend Growth in the last three years in percentage. Same as above, but this is mostly for trending. This shows the company is consistent with the raise. |
| Div Growth. 5 Y |
| Dividend Growth in the last five years in percentage. Same as above, great for trending as it shows how constant the dividend increases are or not. It also gives you insight if that percentage has been decreasing or increasing as the years passed. |
| Returns 1 Y |
| Stock price return in the past year in dollars. For those interested in value growth as well. This tells you how much the stock price went up (or down) compared to the same period last year. |
| Returns 5 Y |
| Stock price return in the past five years in dollars. Same as above, but this shows you a better picture on how the price has moved. If down compared to current period, the returns have not been great. If up a few dollars it has been consistent in price and is good as long as the dividend keeps paying. If up then the company has been growing in value and with a growing dividend you have a good combination of Dividend and Growth. |
| CAGR 5 Y |
| Stands for Compound Annual Growth Rate for five years as a percentage. This tells you the rate which the investment increased (or decreased) in a five year period. Rather than staring at the ups and downs of the stock this smooths out the line to see a better overall view. |
| Growth 1 Y |
| Stock price returns in the past year as a percentage. By showing it as a percentage it will be easy to compare to others in the industry. |
| Cash flow per share $ (Coming Soon) |
| This is the price of the share after all operating expenses are removed in dollars. This is good to tell you that the company has left over cash after paying all debts, having this leftover cash means less chances of the company decreasing or stopping the dividend. |
| Free Cash Flow Payout (Coming Soon) |
| This combines Outstanding shares with Cash flow per share to get the payout in a percentage. This Ratio is not very good to use as analysis when it comes to REITs and BCDs due to how they work. For Information on our Free Cash Flow Payout Ratio calculation check out this article. |
| Yield Industry avg |
| This is the Dividend Yield Industry Average as a percentage. This is the average of all dividend stocks in that industry only. |
| Div Growth Industry avg |
| This the Dividend Growth industry average in the last year as a percentage. |
| Growth 1 Y Industry avg |
| This is the Stock price returns industry average in the past year as a percentage. |
| FCFPR Industry avg (Coming Soon) |
| This Free Cash Flow Payout Ratio industry average as a percentage. |