So you visited a Ticker Page found this and clicked it?
![]()
And not to sure what it all means? then you’re on the right place.
What you saw is the Dividend and Growth Scorecard.
It was created to compare the current stock you’re viewing against the average of all others in that industry.
We selected four different metrics in percentages and the data is for the last twelve trailing Months.
| Yield |
| Dividend Growth |
| Growth |
| Free Cash Flow Payout Ratio |
Knowing this when you look at the Scorecard it would look something like this:
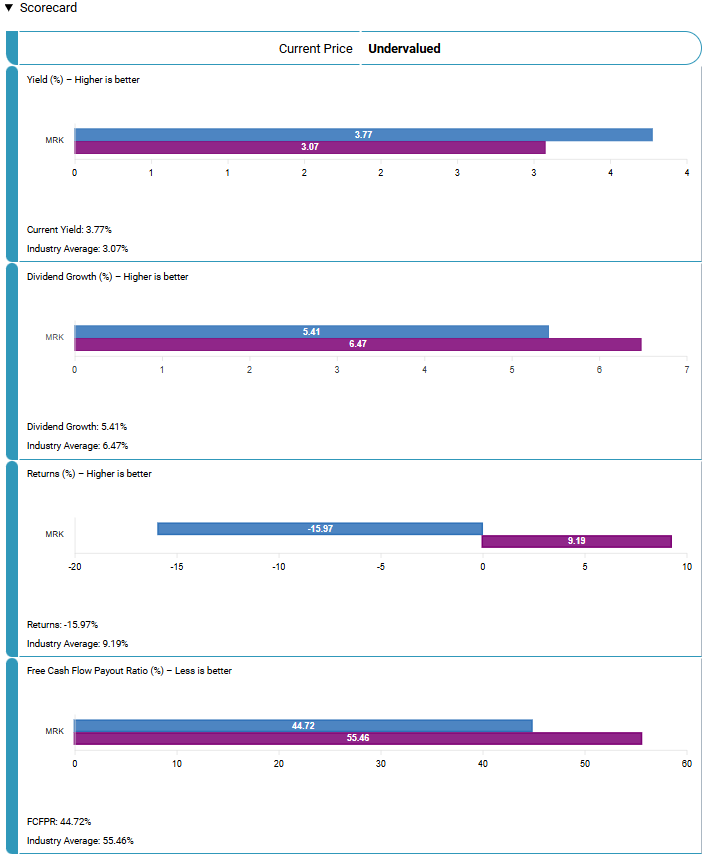
We will use the company MRK (Merck & Co., INC.) which belongs to the Pharmaceutical Industry.
This is a snapshot as of Oct. 31, 2025.
Current Price: At the top is based on the Fair Price Valuation, the Guide is HERE. It tells you right away if the current price is worth it based on the calculation of historic Dividend. In this case Merck is at a good price to buy.
Yield: Merck’s Dividend is above the average of Pharmaceutical companies that pay a Dividend. Making attractive for those who want a big pay out.
Dividend Growth: Merck is lower than average when it comes to increasing their dividend compared to its peers. The difference is not so bad (about 1.06% less). Still there is some decent growth happening.
Returns: Compare to its peers Merck is not doing too good stock price wise this year. This of course would require a bit of research on why the price is lower this time compared to last year, bad news? little growth? this is a down cycle? Some might look at this as an opportunity to invest at discount prices.
Free Cash Flow Payout Ratio: This is a different method to check how safe the dividend is (Like Payout Ratio). This one uses the free cash flow the company has vs its cash flow per share. (Basically if the leftover money is enough to pay all investor dividends). The lower the better, which means Merck has plenty of cash to cover the dividend without breaking their bank.
Please be aware when it comes to REITs which invest most of the money back due to their investing structure the FCFPR will have very random numbers and will not be too reliable, so heads up.
In Conclusion, by just looking into the Scorecard, Merck would be a great investment, of course this is just a few metrics, more research is recommended before making any investment decisions.
How Does it Work?
When it comes to Dividends and Growth comparing all of them will not give you a very good view of if where the stock you’re looking at really stacks.
This is due to how different industries work or might be happening to the overall industry at that period.
Some industries are cyclical which means some months or even years they will be down or up depending on what is currently happening in the world.
With this is mind, wouldn’t it be more accurate to compare the stock against its peers?
By finding the industry average you get an idea of where the industry stands at that point.
Then using the information of the stock you are comparing to, you get a sense of where that company stands next to its peers.
We selected four different metrics in percentages. Using dollar values would throw all the numbers off due to big changes in pricing of some stocks within the same Industry.
Going back, the Metrics are:
| Yield |
| Total Dividend Yield in percentage. This gives you a good indication of how much of the total price of the stock is being given as a dividend. Higher means more money, but might not always be a good thing. |
| Dividend Growth |
| Dividend Growth in the last year in percentage. The higher the better, this tells you how much of an increase the dividend grew or did not. Think of it the same way as a raise at your job, the higher the percentage the more you will get. |
| Growth |
| Stock price returns in the past year as a percentage. By showing it as a percentage it will be easy to compare to others in the industry. |
| Free Cash Flow Payout Ratio |
| This combines Outstanding shares with Cash flow per share to get the payout in a percentage. |
As with our conclusion with the example above, these metrics are good, but should not be the only deciding factor to invest.
Research is important, but hopefully this will give you a few more important data points to review.