Scorecard
| Current Price | Overvalued | |
|
Yield – Higher is better | ||
|
Dividend Growth – Higher is better | ||
|
Returns – Higher is better | ||
|
17.05% Free Cash Flow Payout Ratio – Less is better | ||
ABBVIE INC.
(XNYS:ABBV)
Industry: Pharmaceuticals
| Price | Change (Daily) |
| $ 189.26 | $ -2.14 |
Dividend
|
Annual Dividend
|
Annual Yield
|
|
$ 6.56
|
3.47 %
|
Fair Price
| Current Price ● $ 189.26 |
| Less Than $ 127.53 | $ 127.53 – $ 184.22 | More Than $ 184.22 |
| Undervalued | Fair Price | Overvalued |
Stock current price is considered: Overvalued
Learn about our Fair Price analysis here.
Dividend History
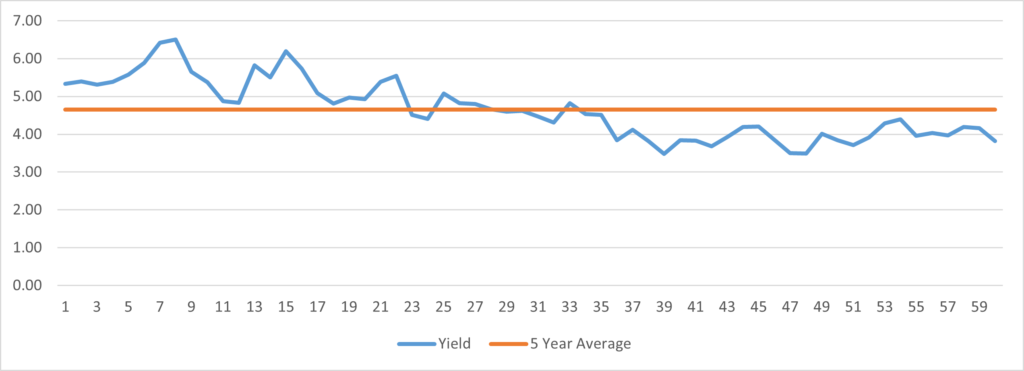
5 Year Average: % 4.23
Growth
Dividend Growth Rate
|
1 Year
|
3 Year
|
5 Year
|
|
4.73 %
|
6.05 %
|
7.72 %
|
Price Return
|
1 Year
|
5 Year
|
CAGR
|
|
$ 3.94
% 2.08 |
$ 94.35
|
14.80 %
|