Scorecard
| Current Price | Undervalued | |
| Yield (%) – Higher is better Current Yield: 0.80% Industry Average: 1.90% | ||
| Dividend Growth (%) – Higher is better Dividend Growth: 4.50% Industry Average: 8.36% | ||
| Returns (%) – Higher is better Returns: 7.67% Industry Average: -9.20% | ||
| Free Cash Flow Payout Ratio (%) – Less is better FCFPR: 17.47% Industry Average: 0.00% | ||
AGILENT TECHNOLOGIES, INC.
(XNYS:A)
Industry: Healthcare Equipment & Supplies
| Price | Change (Daily) |
| $ 127.06 | $ 2.73 |
Dividend
Annual Dividend | Annual Yield |
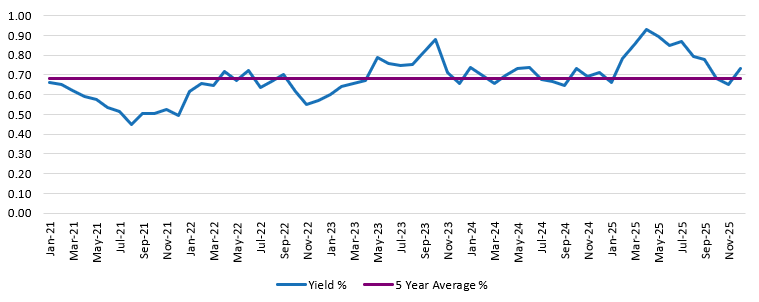
$ 1.02 | 0.80 % |
Dividend Streak | 5 Year Average |
13 year(s) | 0.68 % |
Yield History
Fair Price
Current Stock price is considered: Undervalued
| Current Price ● $127.06 |
| Less Than $147.95 | $147.95 – $156.37 | More Than $156.37 |
| Undervalued | Fair Price | Overvalued |
Using average Dividend Yield for stock valuation. Learn about this method for Fair Price analysis HERE.
Growth
Dividend Growth Rate
1 Year | 3 Year | 5 Year |
4.50 % | 5.33 % | 6.37 % |
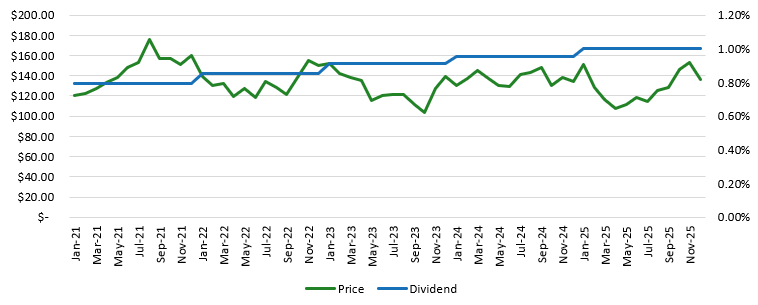
Dividend History
| 2021 | 2022 | 2023 | 2024 | 2025 |
| $0.79 | $0.86 | $0.91 | $0.96 | $1.00 |
Price Return
1 Year | 5 Year | CAGR 5 Years |
$ 9.05 7.67 % | $ -20.75 | -2.98 % |