Scorecard
| Current Price | Undervalued | |
| Yield (%) – Higher is better Current Yield: 4.13% Industry Average: 5.34% | ||
| Dividend Growth (%) – Higher is better Dividend Growth: 3.54% Industry Average: 3.23% | ||
| Returns (%) – Higher is better Returns: -11.43% Industry Average: 6.27% | ||
| Free Cash Flow Payout Ratio (%) – Lower is better Coming Soon FCFPR: 0.00% Industry Average: 0.00% | ||
INVITATION HOMES INC.
(XNYS:INVH)
Industry: Residential & Commercial REIT
| Price | Change (Daily) |
| $ 29.05 | $ 0.61 |
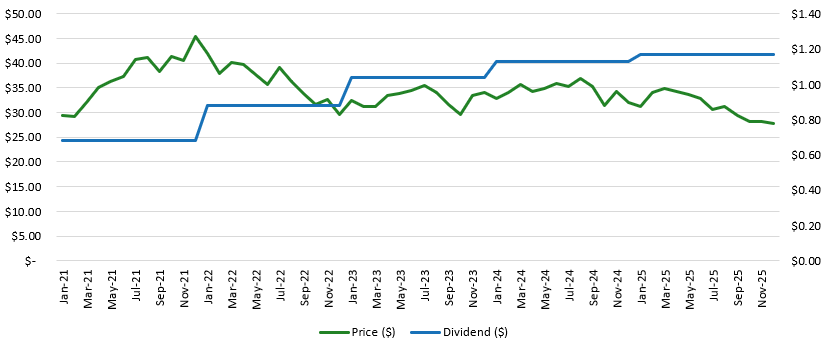
Dividend
Annual Dividend | Annual Yield |
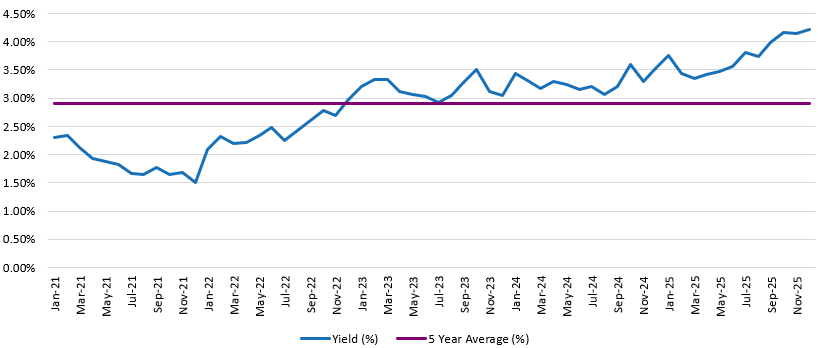
$ 1.20 | 4.13 % |
Dividend Streak | 5 Year Average |
8 year(s) | 2.90 % |
Yield History
Fair Price
Current Stock price is considered: Undervalued
| Current Price ● $29.05 |
| Less Than $32.82 | $32.82 – $61.20 | More Than $61.20 |
| Undervalued | Fair Price | Overvalued |
Using average Dividend Yield for stock valuation. Learn about this method for Fair Price analysis HERE.
Growth
Dividend Growth Rate
1 Year | 3 Year | 5 Year |
3.54 % | 10.13 % | 14.62 % |
Dividend History
| 2021 | 2022 | 2023 | 2024 | 2025 |
| $0.68 | $0.88 | $1.04 | $1.13 | $1.17 |
Price Return
1 Year | 5 Year | CAGR 5 Years |
$ -3.75 -11.43 % | $ -8.24 | -4.87 % |